OPeNDAP Data Connector Tutorial
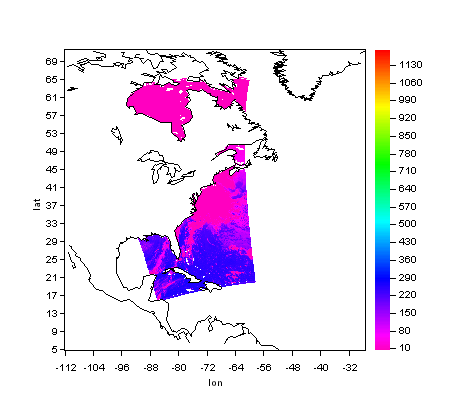
This tutorial walks you through the basic operations in the OPeNDAP Data Connector. It is highly recommended that new users do the tutorial to get oriented to the software. In the tutorial you will go through the steps to create the following plot:

Step-By-Step
Operating the ODC involves three steps:
- identify the dataset you want to use (Search)
- retrieve its structure and make a sub-selection of the data if desired (Retrieve)
- output or view the data (View)
The controls for these three steps are grouped onto three tabs accessible at the top of the screen.
Follow along to learn how to do these steps. In some cases there will be a hyperlink if there are more detailed directions for a particular step on a different page.
- go to Search / Dataset List tab
- click once on the "+" to go into the "University of Rhode Island ..." folder
- go into the "1.1km Northwest Atlantic AVHRR" folder
- single click (DO NOT DOUBLE CLICK) on "Pathfinder SST"; your choice will highlight
[notice how the URL for the dataset is shown at right] - single click the red "To Retrieve" button at the top of the screen
[you should now move automatically to the retrieve panel]
[Pathfinder SST will be listed as one of your selected datasets]
[notice that it is highlighted; this means it is the active dataset]
[if you get an error, check your network connection]
- navigate the directory tree by double-clicking the folders to a month of your choice
[a list of data granules for the month will appear on the right]
[each sub-directory accessed will do a network hit]
- double click one of the granules; this will load its structure
[a "granule" is a file]
[the structure of the granule will appear in the pane below]
- click the radio button next to Grid and do likewise for the "dsp_band_1" variable
- modify the array ranges so they read "0:10:6143" (enter key "saves" the change)
[this specifies you only want every 10th value in the array]
[we subset the data like this because a 6143 x 6143 matrix
would take a lot longer to process without adding much more to see]
- select "Plotter" in the drop-down list next to the "Output to" button
- click the "Output to" button
[you will automatically move to the View/Plot pane]
[the data will automatically be loaded to the plot pane]
[this dataset is about 1.5 megabytes]
- single click plot type "Pseudocolor" if it is not already selected
[the x and y values will automatically be picked for you]
- single click the blue "Plot" button
[a plot of the data will appear in a separate window]
Congratulations you have done a plot!
Extra Credit - If you want to add in the coastline go to the options tab and change 'Show Coastline' to yes [you have to reverse the y-axis to get the coast oriented correctly]
You can learn more about plotting by perusing the plot gallery.
See our OPeNDAP home for more information about OPeNDAP.