QuickStart: Difference between revisions
(New page: = An <nop>OPeNDAP Quick Start Guide = Tom Sgouros \chapter{What To Do With An <nop>OPeNDAP URL} The \OPD\ is a system that allows you to access data over the internet, from programs that...) |
No edit summary |
||
| (124 intermediate revisions by 3 users not shown) | |||
| Line 1: | Line 1: | ||
An OPeNDAP Quick Start Guide | |||
Tom Sgouros | |||
<font size="-1">This guide to using OPeNDAP's software was originally written by Tom Sgouros</font> | |||
[http://www.opendap.org/<cite>OPeNDAP</cite>] provides software that allows you to access data over the internet, | |||
from programs that weren't originally designed for that purpose, as | from programs that weren't originally designed for that purpose, as well as some that were. While OPeNDAP is the original developer of the [http://www.opendap.org/pdf/ESE-RFC-004v1.1.pdf Data Access protocol] which its software uses, many other groups have adopted DAP and provide compatible clients, servers and software development kits. The DAP is a [http://earthdata.nasa.gov/our-community/esdswg/standards-process-spg NASA community standard]; here is the [http://earthdata.nasa.gov/our-community/esdswg/standards-process-spg/rfc/esds-rfc-004-dap-20 offical link] to the specification. | ||
well as some that were. | |||
With | |||
With OPeNDAP software, you access data using a URL, just like a URL you would use | |||
to access a web page. However, before you request any data, you need | to access a web page. However, before you request any data, you need | ||
to know how to request it in a form your browser can handle. | to know how to request it in a form your browser can handle. OPeNDAP | ||
data is stored in binary form, and by default, it is transmitted that | data is stored in binary form, and by default, it is transmitted that | ||
way, too. | way, too. | ||
Another thing to consider with an OPeNDAP URL is that a single URL might point to | |||
an archive containing 50 megabytes of data. You rarely want to | an archive containing 50 megabytes of data. You rarely want to | ||
request the whole thing without knowing a little about it. | request the whole thing without knowing a little about it. OPeNDAP | ||
provides sophisticated sub-sampling capabilities, but you need to know | provides sophisticated sub-sampling capabilities, but you need to know | ||
something about the data in order to use them. | |||
So here's what to do if someone gives you a raw URL, and says there's some OPeNDAP data on the other end. | |||
=What To Do With An OPeNDAP URL= | |||
Suppose someone gives you a hot tip that there's a lot of good data | Suppose someone gives you a hot tip that there's a lot of good data at: | ||
at: | |||
<pre> | <pre> | ||
http:// | http://test.opendap.org/dap/data/nc/sst.mnmean.nc.gz | ||
</pre> | </pre> | ||
This URL points to monthly means of sea surface temperature, | This URL points to monthly means of sea surface temperature, | ||
worldwide, compiled by Richard Reynolds at the Climate Modeling branch | worldwide, compiled by Richard Reynolds at the Climate Modeling branch | ||
of NOAA, but pretend you don't know that yet. | of NOAA, but pretend you don't know that yet. | ||
The simplest thing you can do with this URL is to download the data it | The simplest thing you can do with this URL is to download the data it | ||
points to. You could feed it to an | points to. You could feed it to an OPeNDAP-enabled data analysis package | ||
like Ferret, or you could append | like Ferret, or you could append '''.ascii''', and feed the URL to a | ||
regular web browser like | regular web browser like Firefox or Safari. This will work, but you don't | ||
really want to do it because in binary form, there are about | really want to do it because in binary form, there are about 60 | ||
megabytes of data at that URL. | megabytes of data at that URL. | ||
<blockquote>NOTE: An OPeNDAP server will work with many different clients, some of which are supported by the OPeNDAP team, and some of which are supported by others. The operation of any individual package is beyond the scope of this manual. This guide explains how to use a typical web browser such as Firefox, Internet Explorer or Safari to discover information about the data that will be useful when analyzing data in ''any'' package.</blockquote> | |||
A better strategy is to find out some information about the data. | A better strategy is to find out some information about the data. | ||
OPeNDAP has sophisticated methods for subsampling data at a remote site, | |||
but you need some information about the data first. First, we'll try | but you need some information about the data first. First, we'll try | ||
looking at the data's | looking at the data's Dataset Descriptor Structure (DDS). This | ||
provides a description of the "shape" of the data, using a vaguely | provides a description of the "shape" of the data, using a vaguely | ||
C-like syntax. You get a dataset's DDS by appending | C-like syntax. You get a dataset's DDS by appending '''.dds''' to the | ||
[http:// | [http://test.opendap.org/dap/data/nc/sst.mnmean.nc.gz.dds URL]. | ||
<center> | |||
From the DDS shown, you can see that the dataset consists of | [[Image:Reynolds_dds.png|actual size]] | ||
pieces: | |||
[http://test.opendap.org/dap/data/nc/sst.mnmean.nc.gz.dds An OPeNDAP DDS(sst.mnmean.nc.gz.dds)] | |||
</center> | |||
*A | |||
*A | From the DDS shown, you can see that the dataset consists of two | ||
*A | different pieces: | ||
*A | |||
*A "Grid" containing a three-dimensional array of integer values (Int16) called sst, and three "Map" vectors: | |||
multidimensional array, and | **A 89-element vector called "lat", | ||
**A 180-element vector called "lon", | |||
**A 1857-element vector called "time", and | |||
*A 1857 by 2 array called "time_bnds". | |||
The Grid is a special OPeNDAP data type that includes a | |||
multidimensional array, and map vectors that indicate the | |||
independent variable values. That is, you can use a Grid to store an | independent variable values. That is, you can use a Grid to store an | ||
array where the rows are not at regular intervals. | array where the rows are not at regular intervals. Here's a diagram of a simple grid: | ||
<center> | |||
[[Image:gridpts.gif]] | |||
The array part of the grid would contain the data points measured at | |||
each one of the squares, the X map vector would contain the positions | A Grid | ||
of the columns, and the Y map vector would contain the positions of | </center> | ||
the rows. | |||
The array part of the grid (like '''sst''' in the example above) | |||
would contain the data points measured at each one of the squares, the | |||
X map vector would contain the horizontal positions of the columns | |||
(like the '''lon''' vector above), and the Y map vector would | |||
contain the vertical positions of the rows (like the '''lat''' | |||
vector above). | |||
Of course you can also use a Grid to store arrays where the columns | Of course you can also use a Grid to store arrays where the columns | ||
and rows are at regular intervals, and you'll often see | and rows are at regular intervals, and you'll often see OPeNDAP data | ||
way. | stored that way. | ||
(The other special | |||
''Sequence'' . You'll see more about them | (The other special OPeNDAP data type worth worrying about is the | ||
''Sequence'' . You'll see more about them later. There are also ''Structures'' for representing arbitrary hierarchies.) | |||
You can see from the DDS that the Reynolds data is in a 89x180x1857 | |||
You can see from the DDS that the Reynolds data is in a | |||
element grid, and the dimensions of the Grid are called "lat", | element grid, and the dimensions of the Grid are called "lat", | ||
"lon", and "time". This is suggestive, but not as helpful as one | "lon", and "time". This is suggestive, but not as helpful as one | ||
could wish. To find out more about what the data ''is'' , you can | could wish. To find out more about what the data ''is'', you can | ||
look at the other important | look at the other important OPeNDAP structure: the | ||
Data Attribute Structure, or DAS. This structure is somewhat similar to the DDS, | |||
but contains information about the data, such as units and the name of | but contains information about the data, such as units and the name of | ||
the variable. Part of the DAS for the Reynolds data we saw above is | the variable. Part of the DAS for the Reynolds data we saw above is | ||
shown in the figure below. Click [http://test.opendap.org/dap/data/nc/sst.mnmean.nc.gz.das sst.mnmean.nc.gz.das] to see the rest of it. | |||
<center> | |||
[[Image:Reynolds_das.png]] | |||
[http://test.opendap.org/dap/data/nc/sst.mnmean.nc.gz.das sst.mnmean.nc.gz.das] | |||
</center> | |||
of this, the quality of the data in it (the | |||
<blockquote>NOTE: Unlike the DDS, the DAS is populated at the data | |||
provider's discretion. Because | |||
of this, the quality of the data in it (the metadata) varies | |||
widely. The data in the Reynolds dataset used in this example are | widely. The data in the Reynolds dataset used in this example are | ||
COARDS compliant. Other metadata standards you may encounter with | COARDS compliant. Other metadata standards you may encounter with | ||
OPeNDAP data are HDF-EOS, EPIC, FGDC, or no metadata at all.</blockquote> | |||
Now we can tell something more about the data. Apparently the | Now we can tell something more about the data. Apparently the | ||
'''lat''' vector contains latitude, in degrees north, and the range is | |||
from 89.5 to -89.5. Since this is a global grid, the latitude values | from 89.5 to -89.5. Since this is a global grid, the latitude values | ||
probably go in order. We can check this by asking for just the | probably go in order. We can check this by asking for just the | ||
latitude vector, like | latitude vector, like | ||
http:// | <pre> | ||
http://test.opendap.org/dap/data/nc/sst.mnmean.nc.gz.ascii?lat | |||
</pre> | </pre> | ||
What we've done here is to append a | |||
What we've done here is to append a constraint expression to the OPeNDAP URL, to indicate how to | |||
constrain our request for data. Constraint expressions can take many | constrain our request for data. Constraint expressions can take many | ||
forms. This guide will only describe a few of them. (You can refer | forms. This guide will only describe a few of them. (You can refer | ||
to the | to the [http://docs.opendap.org/UG/OPeNDAP_User%27s_Guide User's Guide] for more complete information about constraint expressions.) Try requesting the | ||
expressions.) Try requesting the | [http://test.opendap.org/dap/data/nc/sst.mnmean.nc.gz.ascii?time time] | ||
and [http://test.opendap.org/dap/data/nc/sst.mnmean.nc.gz.ascii?lon longitude] vectors to see how this works. | |||
and [http:// | |||
According to the DAS, time is kept in "days since 1800-1-1 00:00:00" | |||
vectors to see how this works. | in this dataset. This DAS also contains the actual time period | ||
recorded in the data (19723 to 76214) which, because of your | |||
According to the DAS, time is kept in "days since | familiarity with the Julian calendar, you instantly recognize as | ||
this dataset. | beginning January 1, 1854. | ||
recorded in the data which, because of your familiarity with the | |||
Julian calendar, you instantly recognize as beginning | |||
OPeNDAP provides an '''info''' service that returns all the | |||
we've seen so far in a single | information we've seen so far in a single request. The returned | ||
request. | information is also formatted differently (some would say "nicer"), | ||
would say "nicer"), and you can occasionally find server-specific | and you can occasionally find server-specific documentation here, as | ||
documentation here, as well. Some will find this the easiest way to | well. Some will find this the easiest way to read the attribute and | ||
read the attribute and structure information. You can see what | structure information described above. You can see what information | ||
is available by appending '''.info''' to a URL, like | |||
[http:// | [http://test.opendap.org/dap/data/nc/sst.mnmean.nc.gz.info<cite>this</cite>]: | ||
http:// | <pre> | ||
http://test.opendap.org/dap/data/nc/sst.mnmean.nc.gz.info | |||
</pre> | </pre> | ||
=Peeking at Data= | ==Peeking at Data== | ||
Now that we know a little about the shape of the data, and the data | Now that we know a little about the shape of the data, and the data | ||
attributes, let's look at some of the data. | attributes, let's look at some of the data. | ||
You can request a piece of an array with subscripts, | You can request a piece of an array with subscripts, just like in a C | ||
just like in a C program or in Matlab or many other computer | program or in Matlab or many other computer languages. Use a colon to | ||
languages. Use a colon to indicate a subscript range. | indicate a subscript range. | ||
...sst/mnmean.nc. | [http://test.opendap.org/dap/data/nc/sst.mnmean.nc.gz.ascii?time%5b0:6%5d <nowiki>...sst/mnmean.nc.ascii?time[0:6]</nowiki>] | ||
</ | |||
This [http:// | This [http://test.opendap.org/dap/data/nc/sst.mnmean.nc.gz.ascii?time%5b0:6%5d URL] will produce | ||
<center> | |||
[http:// | [[Image:Reynolds time vector.png]] | ||
for | |||
Part of a vector | |||
...sst/mnmean.nc. | </center> | ||
</ | |||
If you are interested in the Reynolds dataset, you are probably more interested in the sea surface temperature data than the dependent variable vectors. The temperature data is a three-dimensional grid. To sample the | |||
[http://test.opendap.org/dap/data/nc/sst.mnmean.nc.gz.ascii?sst%5b0:1%5d%5b13:16%5d%5b103:105%5d sst] | |||
Grid, you just add a dimension for time: | |||
Notice that when you ask for part of an | |||
part along with the corresponding parts of the map vectors. | [http://test.opendap.org/dap/data/nc/sst.mnmean.nc.gz.ascii?sst%5b0:1%5d%5b13:16%5d%5b103:105%5d<nowiki>...sst/mnmean.nc.ascii?sst[0:1][13:16][103:105]</nowiki>] | ||
This produces something like: | |||
<center> | |||
[[Image:Reynolds_sst.png]] | |||
...sst/mnmean.nc. | [http://test.opendap.org/dap/data/nc/sst.mnmean.nc.gz.ascii?sst%5b0:1%5d%5b13:16%5d%5b103:105%5d Part of the Reynolds SST data] | ||
</ | </center> | ||
Notice that when you ask for part of an OPeNDAP Grid, you get the array part along with the corresponding parts of the map vectors. | |||
Note that the sst values are in | One potentially confusing thing about this request is that we | ||
indicated by the | requested the time, latitude and longitude by their position in the | ||
map vectors, but in the returned information they are referenced by | |||
their values. That is, we asked for the 0th and 1st time values, but | |||
these are 19723 and 19754. We also asked for the 103rd, 104th and | |||
105th longitude values, but these are 206, 208, and 210 degrees, | |||
respectively. The value 434 in the return can be referenced as | |||
[http://test.opendap.org/dap/data/nc/sst.mnmean.nc.gz.ascii?sst%5b1%5d%5b15%5d%5b103%5d<nowiki>...sst/mnmean.nc.ascii?sst[1][15][103]</nowiki>] | |||
Note that the sst values are in Celsius degrees multiplied by 100, as | |||
indicated by the '''scale_factor''' attribute of the [http://test.opendap.org/dap/data/nc/sst.mnmean.nc.gz.das DAS]. | |||
Further, it's important to remember with this dataset, that the data | Further, it's important to remember with this dataset, that the data | ||
were obtained by calculating spatial and temporal means. | were obtained by calculating spatial and temporal means. | ||
Consequently, the data points in the | Consequently, the data points in the '''sst''' array should be ignored | ||
when the | when the value is the missing data flag (32767) as these pixels are probably coincident with land (although there can be other reasons for missing data). | ||
% | ===Server Functions: Looking at geo-referenced data using Hyrax=== | ||
== | |||
There are a number of different DAP servers that have been developed | |||
by different organizations. Hyrax, the DAP server developed by the | |||
OPeNDAP group, supports access to geo-referenced data using lat/lon | |||
coordinates. You probably noticed that the array and grid indexes used | |||
so far are not very intuitive. You can see the data are global and are | |||
indexed by latitude and longitude, but in the previous example we | |||
first looked at the lat and lon vectors, saw which indexes | |||
corresponded to which real-world locations and then made our accesses | |||
using those indexes. | |||
Hyrax supports a small set of functions which can perform | |||
these look-up operations for you. For example, we could rewrite the | |||
example above like this: | |||
[http://test.opendap.org/opendap/data/nc/sst.mnmean.nc.gz.ascii?geogrid(sst,62,206,56,210,%2219722%3Ctime%3C19755%22)<nowiki>...mnmean.nc.gz.ascii?geogrid(sst,62,206,56,210,"19722<time<19755")</nowiki>] | |||
This produces: | |||
<center> | |||
[[Image:Reynolds sst geogrid.png]] | |||
[http://test.opendap.org/opendap/data/nc/sst.mnmean.nc.gz.ascii?geogrid(sst,62,206,56,210,%2219722%3Ctime%3C19755%22) Part of the Reynolds SST data] | |||
</center> | |||
The Syntax for <tt>geogrid()</tt> is: | |||
:geogrid(grid variable, upper latitude, left longitude, lower latitude, right longitude, ''other expressions'') | |||
Where ''other expressions'' must be enclosed in double quotes, and can | |||
be one of these forms: | |||
: variable relop value | |||
: value relop variable | |||
: value relop variable relop value | |||
"Relop" stands for one of the relational operators: | |||
<,>,<=,>=,=,!=. "Value" stands for a numeric constant, and "Variable" | |||
must be the name of one of the grid dimensions. You can use multiple | |||
clauses by separating them with commas, but each clause must be | |||
surrounded by double quotes. For example, the following is yet | |||
another way to get the same return data as the above example. | |||
[http://test.opendap.org/opendap/data/nc/sst.mnmean.nc.gz.ascii?geogrid(sst,62,206,56,210,%2219722%3Ctime%22,%22time%3C19755%22)<nowiki>...mnmean.nc.gz.ascii?geogrid(sst,62,206,56,210,"19722<time","time<19755")</nowiki>] | |||
You can figure out which functions are supported by Hyrax by calling | |||
the server function | |||
[http://test.opendap.org/dap/data/nc/sst.mnmean.nc.gz.ascii?version() version()]. This will return an XML document that | |||
shows each registered function and its version. | |||
To find out how to call each function, you can call it with an empty | |||
parameter list and get some | |||
documentation for that function. For example, try [http://test.opendap.org/dap/data/nc/sst.mnmean.nc.gz.ascii?geogrid()<nowiki>...?geogrid()</nowiki>]. | |||
===More fun with Server Functions=== | |||
Server functions can be composed to form pipelines, feeding the value of one function to another. Since the values in this data set are scaled up by a factor of 100, we can use the ''linear_scale()'' function to scale the result using <pre>y = mx + b</pre> where '''m''' is the scale factor and '''b''' offset. The ''linear_scale()'' function syntax is: | |||
: linear_scale(variable, scale factor, offset) | |||
: linear_scale(variable) | |||
Use the first form when you want to specify '''m''' and '''b''' explicitly or the second form when Hyrax can guess the values using data set metadata (you'll get an error if the server cannot figure out value to use). | |||
[http://test.opendap.org/opendap/data/nc/sst.mnmean.nc.gz.ascii?linear_scale(geogrid(sst,78,0,56,10,%22time=19723%22),0.01,0)<nowiki>...nc.gz.ascii?linear_scale(geogrid(sst,78,0,56,10,"time=19723"),0.01,0)</nowiki>] | |||
=Sequence Data= | This produces: | ||
<center> | |||
[[Image:Reynolds sst linear scale geogrid.png]] | |||
[http://test.opendap.org/opendap/data/nc/sst.mnmean.nc.gz.ascii?linear_scale(geogrid(sst,78,0,56,10,%22time=19723%22),0.01,0) Part of the Reynolds SST data, scaled] | |||
</center> | |||
==Sequence Data== | |||
Gridded data works well for satellite images, model data, and data | Gridded data works well for satellite images, model data, and data | ||
compilations such as the Reynolds data we've just looked at. Other | compilations such as the Reynolds data we've just looked at. Other | ||
data, such as data measured at a specific site, is not so readily | data, such as data measured at a specific site, is not so readily | ||
stored in that form. | stored in that form. OPeNDAP provides a data type called a Sequence | ||
to store this kind of data. | to store this kind of data. | ||
A Sequence can be thought of as a relational data table, with each | A Sequence can be thought of as a relational data table, with each | ||
column representing a different data | column representing a different data variable, and each row | ||
a different | representing a different measurement of a set of values (also called an | ||
profile | "instance"). For example, an ocean temperature profile can be stored | ||
and a weather station's data can be stored as a Sequence with time in | as a Sequence with two columns: pressure and temperature. Each | ||
measurement is a pressure and a temperature, and is contained in one row. A | |||
weather station's data can be stored as a Sequence with time in one | |||
column, and each weather variable occupying another column. | |||
You can find a good example of a Sequence at: | |||
http:// | |||
[http://test.opendap.org/dap/data/ff/gsodock.dat.info http://test.opendap.org/dap/data/ff/gsodock.dat] | |||
This is a 24-hour record of measurements at a weather station on a | |||
dock in Rhode Island. Each record consists of a dozen different | |||
variables including air temperature, wind speed, and direction, as | |||
well as depth, temperature and salinity of the water. The data is | |||
arranged into 144 measurements of each of the twelve variables. | |||
Ask for the DDS, and you'll see the twelve variables, all contained in | |||
a Sequence called URI_GSO-Dock: | |||
[http:// | <center> | ||
[[Image:gsodock-dds.png]] | |||
[http://test.opendap.org/dap/data/ff/gsodock.dat.dds<nowiki>A DDS for | |||
Sequence data</nowiki>] | |||
</center> | |||
The DAS contains the units for each data type, and a little other | |||
information: | |||
<center> | |||
[[Image:gsodock-das.png]] | |||
[http://test.opendap.org/dap/data/ff/gsodock.dat.das<nowiki>A DAS for | |||
Sequence data</nowiki>] | |||
</center> | |||
To select which data you want from a server, use a constraint | |||
expression, just as you did with the gridded data above. Now, though, | |||
... | the constraint contains two kinds of clauses. One is a list of | ||
</ | variables you wish to have returned, and the other is the conditions | ||
under which they should be returned. The first is called the | |||
'''projection''' clause and the second the '''selection''' clause. | |||
For example, if you want to see salinity data read after noon that | |||
day, try this: | |||
Selection clauses can be stacked endlessly against a | |||
the flexibility most people need to sample data files. Here's an | [http://test.opendap.org/dap/data/ff/gsodock.dat.ascii?URI_GSO-Dock.Salinity&URI_GSO-Dock.Time%3E35234.5<nowiki>...gsodock.dat.ascii?URI_GSO-Dock.Salinity&URI_GSO-Dock.Time>35234.5</nowiki>] | ||
example of | |||
[http:// | |||
Selection clauses can be stacked endlessly against a projection clause, allowing all | |||
the flexibility most people need to sample data files. Here's an | |||
example of applying two conditions: | |||
... | |||
</ | [http://test.opendap.org/dap/data/ff/gsodock.dat.ascii?URI_GSO-Dock.Salinity&URI_GSO-Dock.Time%3E35234.5&URI_GSO-Dock.Depth%3E2<nowiki>...gsodock.dat.ascii?URI_GSO-Dock.Salinity&URI_GSO-Dock.Time>35234.5&URI_GSO-Dock.Depth>2</nowiki>] | ||
Try it yourself with three or four conditions, or more. | |||
=An Easier Way= | ==An Easier Way== | ||
OPeNDAP also includes a way to sample data that makes writing a | |||
constraint expression somewhat easier. Append '''.html''' to the URL, | |||
constraint expression somewhat easier. Append | |||
and you get a form that directs you to add information to sample the | and you get a form that directs you to add information to sample the | ||
data | data: [http://test.opendap.org/opendap/data/nc/sst.mnmean.nc.gz.html<nowiki>...sst.mnmean.nc.html</nowiki>] | ||
...sst.mnmean.nc.html | Sending a URL ending in '''.html''' returns a form like this: | ||
</ | |||
Sending a URL ending in | <center> | ||
[[Image:Reynolds ifh.png]] | |||
[http://test.opendap.org/opendap/data/nc/sst.mnmean.nc.gz.html<nowiki>The OPeNDAP Dataset Access Form</nowiki>] | |||
</center> | |||
It's useful to have a browser window open with one of these query forms in it | It's useful to have a browser window open with one of these query forms in it | ||
while you read this section. | while you read this section. Right or Control click | ||
[http://test.opendap.org/opendap/data/nc/sst.mnmean.nc.gz.html<nowiki>here</nowiki>] | |||
to bring up a copy of the form to use while you read. | |||
Near the top of the page, you'll see a box entitled "Data URL". At | Near the top of the page, you'll see a box entitled "Data URL". At | ||
this point, if you've been following along, it should look pretty | this point, if you've been following along, it should look pretty | ||
familiar. If you're just jumping in, it's the | familiar. If you're just jumping in, it's the OPeNDAP URL connected to | ||
the data we're interested in, but unsampled. | the data we're interested in, but unsampled (that is, there's no | ||
constraint expression on it). | |||
Moving down the page, there is a list of "Global Attributes", which | Moving down the page, there is a list of "Global Attributes", which | ||
is really just for your perusal. | is really just for your perusal. There's not much to | ||
be done with this, but it is often helpful information. | be done with this, but it is often helpful information. | ||
of the page is the "Variables" section. For each variable in the | |||
dataset, you'll see the data description ( | The important part of the page is the "Variables" section. For each variable in the | ||
[lat = 0.. | dataset, you'll see the data description (something like "Array of 32 bit Reals | ||
[lat = 0..88]"), a checkbox, a text input box, and a list of the | |||
variable's attributes. If you click on the checkbox, you'll see the | variable's attributes. If you click on the checkbox, you'll see the | ||
variable's array bounds appear in the text box, and you'll see | variable's array bounds appear in the text box, and you'll see the | ||
variable appear in a constraint expression appended to the Data URL at | variable appear in a constraint expression appended to the Data URL at | ||
the top of the page. If you edit the array bounds in the text box, | the top of the page. If you edit the array bounds in the text box, | ||
hitting "enter" will place your edits in the Data URL box. | hitting "enter" will place your edits in the Data URL box. | ||
In the | |||
documentation | |||
In the unlikely event you dare try all this without your | |||
documentation along, there's a '''Show Help''' | |||
button up near the top of the page. Clicking there will show you | button up near the top of the page. Clicking there will show you | ||
instructions about how to proceed. | instructions about how to proceed. | ||
<blockquote>NOTE: You'll see a "stride" mentioned. This is another way to | |||
subsample an OPeNDAP array or Grid. Asking for '''lat[0:4]''' gets you the first | |||
five members of the '''lat''' array. Adding a stride value allows | |||
you to skip array values. Asking for '''lat[0:2:10]''' gets you | |||
every second array value between 0 and | |||
10: 0, 2, 4, 6, 8, 10. </blockquote> | |||
Move on down the variable list, editing your request, and experiment | Move on down the variable list, editing your request, and experiment | ||
with adding and changing variable requests. | with adding and changing variable requests. | ||
When you have a request you'd like to make, look at the buttons at the | When you have a request you'd like to make, look at the buttons at the | ||
top of the page. | top of the page. | ||
<center> | |||
You can click on | [[Image:Reynolds_ifh_Action.png]] | ||
Dataset Access Form Detail | |||
</center> | |||
You can click on '''Get ASCII''', and the data | |||
request will appear in a browser window, in comma-separated form. The | request will appear in a browser window, in comma-separated form. The | ||
'''Binary (DAP) Object''' button will save a binary data file on your local | |||
disk | disk, and the '''Get as NetCDF''' will save the file in netCDF format | ||
on your local disk. (You can read either of these later with several OPeNDAP | |||
clients, by giving it the file name instead of a URL.) | |||
The OPeNDAP Data Access Form interface works for Sequence data as well as | |||
The | |||
Grids. However, since Sequence constraint expressions look different | Grids. However, since Sequence constraint expressions look different | ||
than Grid expressions, the form looks slightly different, too. You | than Grid expressions, the form looks slightly different, too. You | ||
can see | can see that the variable selection boxes allow you to enter relational expressions for | ||
variable selection boxes allow you to enter relational expressions for | |||
each variable. Beside that, however, the function is exactly the same. | each variable. Beside that, however, the function is exactly the same. | ||
<center> | |||
[[Image:gsodock-html.png]] | |||
Dataset Access Form for Sequence Data (detail) | |||
</center> | |||
Click [http://test.opendap.org/dap/data/ff/gsodock.dat.html<nowiki>here</nowiki>] to see a copy of | |||
a Sequence form. Click the checkboxes to choose which data types you want | |||
returned, and then add constraint expressions as desired. This data file contains a day's record of changing water properties off a dock in Rhode Island. If you click the ''Depth'' and ''Time'' boxes (as in the figure), you'll get a record of the tide going in and out twice. You can add conditions by entering values in the text boxes. See what you get when you limit the selection to records where the Depth is greater than 2 meters. | |||
<blockquote>NOTE: The OPeNDAP project supports the server standard and also | |||
provides server software. Other groups also provide server software. This | |||
The | means that not all OPeNDAP servers support all the OPeNDAP | ||
functionality. There are a few OPeNDAP servers out there in the world | |||
that only support the bare minimum required by the standard. That | |||
minimum is to respond to queries for the DDS, DAS, and (binary) data. | |||
The ASCII data and the web access form are optional add-ons that are | |||
not required for the basic OPeNDAP function.</blockquote> | |||
=Finding More OPeNDAP URLs= | |||
The OPeNDAP package was developed to improve ways to share data among | |||
scientists. Many times, data comes in the form of a URL enclosed in | scientists. Many times, data comes in the form of a URL enclosed in | ||
an email message. But there are several other ways to find data served | an email message. But there are several other ways to find data served | ||
by | by OPeNDAP servers. | ||
=GCMD= | ==GCMD== | ||
The [http://gcmd.gsfc.nasa.gov<nowiki>Global Change Master Directory</nowiki>] is a source of a huge | |||
amount of earth science data. They now catalog OPeNDAP URLs for the | |||
amount of earth science data. They now catalog | datasets that have them. You can search on "OPeNDAP" right from the | ||
datasets that have them. You can search on " | |||
main page to find many of these datasets. Try that search, then click | main page to find many of these datasets. Try that search, then click | ||
on one of the data set names that returns, and look at the bottom of | on one of the data set names that returns, and look at the bottom of | ||
the resulting Set Description'' page, under the heading ``Related | the resulting Set Description'' page, under the heading ``Related | ||
URL.'' | URL.'' | ||
If you make that search, check the list for the Reynolds data from | If you make that search, check the list for the Reynolds data from | ||
chapter~1; it should be there. | chapter~1; it should be there. | ||
=Web Interface= | ==Web Interface== | ||
This is a little bit sneaky. Many sites that serve one | This is a little bit sneaky. Many sites that serve one OPeNDAP dataset | ||
serve | also serve others. The OPeNDAP web interface (if it's enabled | ||
by the site) allows you to check the directory structure for other | by the site) allows you to check the directory structure for other | ||
datasets. For example, let's look at the [http:// | datasets. For example, let's look at the [http://test.opendap.org/dap/data/nc/sst.mnmean.nc.gz.html<nowiki>Reynolds data</nowiki>] we saw previously: | ||
we saw | |||
http:// | [http://test.opendap.org/dap/data/nc/sst.mnmean.nc.gz.html<nowiki>http://test.opendap.org/dap/data/nc/sst.mnmean.nc.gz.html</nowiki>] | ||
</ | |||
If we use the same URL, but without the file at the end, we can browse | |||
If we use the same URL, but without the file name at the end, we can browse | |||
the directory of data: | the directory of data: | ||
http:// | |||
</ | [http://test.opendap.org/dap/data/nc/<nowiki>http://test.opendap.org/dap/data/nc/</nowiki>] | ||
The | |||
so, it generates a directory listing, like | |||
The OPeNDAP server checks to see whether the URL is a directory, and if | |||
so, it generates a directory listing, like [http://test.opendap.org/dap/data/nc/<nowiki>this:</nowiki>] | |||
<center> | |||
[[Image:Test.oopendap.org directory view.png]] | |||
[http://test.opendap.org/dap/data/nc/<nowiki>Web Interface Index Listing </nowiki>] | |||
</center> | |||
You can see from the directory listing that the monthly mean dataset | You can see from the directory listing that the monthly mean dataset | ||
we've been looking at is accompanied by a | we've been looking at is accompanied by a host of other datasets. The | ||
site you're looking at is our test data site - we use these datasets | |||
to run many of our nightly tests. All of the files in the the | |||
''/data/nc'' directory are stored in NetCDF files; other directories | |||
under ''/data'' hold data stored in other file types. | |||
< | |||
in it, | <blockquote>'''Note:''' In general, this list is produced by an | ||
OPeNDAP server and this feature works on all servers. However, it | |||
only really understands OPeNDAP data files, so other file types will | |||
simply be sent without any interpretation. This can be useful if the | |||
'other file' happens to be a README or other documentation file since | |||
this makes it simple to serve data stored in files and documented | |||
using plain text files - essentially the person or organization | |||
providing data doesn't need to do anything besides [[Hyrax | installing the server]]. </blockquote> | |||
==File Servers== | |||
Some datasets you'll find are actually lists of other datasets. These | |||
are called ''file servers'' and are themselves OPeNDAP datasets, organized as a Sequence, containing URLs with some other identifying data (often time). You | |||
can request the entire dataset, or subsample it just like any other OPeNDAP dataset. | |||
NASA's atmospheric composition data information services maintains some | |||
OPeNDAP file servers: | |||
[http://acdisc.sci.gsfc.nasa.gov/opendap/catalog/DatapoolCatalog/AIRS/contents.html<nowiki>http://acdisc.sci.gsfc.nasa.gov/opendap/catalog/DatapoolCatalog/AIRS/contents.html</nowiki>] | |||
Try selecting one of the datasets listed in the above, and look at the DDS and DAS of that dataset. You'll see it's a list of OPeNDAP URLs (called '''DODS_URL''' here), labeled with the date of measurement. If you go to the [http://acdisc.sci.gsfc.nasa.gov/opendap/catalog/DatapoolCatalog/AIRS/AIRX3C2M_005-cat.dat.html html form] for one of them, and click on the '''DODS_URL''' checkbox to get a list of URLs, and then add some conditions (try limiting the files to data from 2003), and click '''Get ASCII'''. Now you can cut and paste the resulting URLs to get more data. | |||
= | =Further analysis= | ||
This guide is about forming an OPeNDAP URL. After you have figured out | |||
This guide is about forming an | |||
how to request the data, there are a variety of things you can do with | how to request the data, there are a variety of things you can do with | ||
it. ( | it. (OPeNDAP software mentioned here is available from the [http://www.opendap.org<nowiki>OPeNDAP Home Page</nowiki>] .) | ||
*Use a generic web client like | *Use a generic web client like '''geturl''' (a standard part of the OPeNDAP package), the free programs [http://www.gnu.org/manual/wget-1.5.3/html_mono/wget.html<nowiki>wget</nowiki>] or [http://lynx.browser.org <nowiki>lynx</nowiki>], or even a browser like '''Netscape Navigator''' or '''Internet Explorer''' to download data into a local data file. To be able to use the data further, you will probably have to download the ASCII version by using the '''.ascii''' suffix on the URL, as in the examples shown. | ||
*There are pre-packaged | |||
*The [http://ferret.wrc.noaa.gov/Ferret Ferret] and GrADS | *There are pre-packaged OPeNDAP clients available that can download binary OPeNDAP data from the web into a useful form. As of today, command line clients ('''loaddods''') are available for the Matlab and IDL data analysis environments, with which you can download OPeNDAP data directly into IDL or Matlab objects. | ||
*The Matlab analysis package also supports an | |||
*If you have a data analysis program or package that you like, you can look into the possibility of linking that package to the | *The [http://ferret.wrc.noaa.gov/Ferret Ferret] and [http://www.iges.org/grads/ GrADS] free data analysis packages both support OPeNDAP. You can use these for downloading OPeNDAP data, and for examining it afterwards. (There are limitations. As of \today , Ferret can not read datasets served as Sequence data.) | ||
data you find, is beyond the scope of this | |||
*The Matlab analysis package also supports an OPeNDAP client attached to a graphical user interface. You can use the GUI to create a constrained OPeNDAP URL, and download the data directly into Matlab. The [http://www.opendap.org/user/mgui-html/mgui.html<nowiki>The OPeNDAP Matlab GUI</nowiki>] contains more information about the Matlab GUI client. | |||
*If you have a data analysis program or package that you like, you can look into the possibility of linking that package to the OPeNDAP toolkit library, in effect making your program into a web-capable OPeNDAP client. OPeNDAP libraries exist to mimic the behavior of the [http://www.unidata.ucar.edu/software/netCDF/<nowiki>netcdf</nowiki>], [http://www.hdfgroup.org/<nowiki>HDF</nowiki>] and [http://www1.whoi.edu/jgofs.html<nowiki>JGOFS</nowiki>] data access APIs. If your program already uses one of these APIs, getting it to run with OPeNDAP may be as simple as changing the libraries to which you link it. The [http://www.opendap.org/user/guide-html/guide.html<nowiki>The OPeNDAP User Guide</nowiki>] describes how to do this, and the [http://www.opendap.org/api/pguide-html/pguide.html<nowiki>The OPeNDAP Toolkit Programmer's Guide</nowiki>] describes how you can use the OPeNDAP toolkit directly to create a new application that doesn't use one of the established data access APIs. | |||
The use of these clients, like the ways in which you can analyze the data you find, is beyond the scope of this document. Enjoy. | |||
Latest revision as of 20:44, 5 November 2014
An OPeNDAP Quick Start Guide
This guide to using OPeNDAP's software was originally written by Tom Sgouros
OPeNDAP provides software that allows you to access data over the internet, from programs that weren't originally designed for that purpose, as well as some that were. While OPeNDAP is the original developer of the Data Access protocol which its software uses, many other groups have adopted DAP and provide compatible clients, servers and software development kits. The DAP is a NASA community standard; here is the offical link to the specification.
With OPeNDAP software, you access data using a URL, just like a URL you would use
to access a web page. However, before you request any data, you need
to know how to request it in a form your browser can handle. OPeNDAP
data is stored in binary form, and by default, it is transmitted that
way, too.
Another thing to consider with an OPeNDAP URL is that a single URL might point to
an archive containing 50 megabytes of data. You rarely want to
request the whole thing without knowing a little about it. OPeNDAP
provides sophisticated sub-sampling capabilities, but you need to know
something about the data in order to use them.
So here's what to do if someone gives you a raw URL, and says there's some OPeNDAP data on the other end.
What To Do With An OPeNDAP URL
Suppose someone gives you a hot tip that there's a lot of good data at:
http://test.opendap.org/dap/data/nc/sst.mnmean.nc.gz
This URL points to monthly means of sea surface temperature, worldwide, compiled by Richard Reynolds at the Climate Modeling branch of NOAA, but pretend you don't know that yet.
The simplest thing you can do with this URL is to download the data it points to. You could feed it to an OPeNDAP-enabled data analysis package like Ferret, or you could append .ascii, and feed the URL to a regular web browser like Firefox or Safari. This will work, but you don't really want to do it because in binary form, there are about 60 megabytes of data at that URL.
NOTE: An OPeNDAP server will work with many different clients, some of which are supported by the OPeNDAP team, and some of which are supported by others. The operation of any individual package is beyond the scope of this manual. This guide explains how to use a typical web browser such as Firefox, Internet Explorer or Safari to discover information about the data that will be useful when analyzing data in any package.
A better strategy is to find out some information about the data.
OPeNDAP has sophisticated methods for subsampling data at a remote site,
but you need some information about the data first. First, we'll try
looking at the data's Dataset Descriptor Structure (DDS). This
provides a description of the "shape" of the data, using a vaguely
C-like syntax. You get a dataset's DDS by appending .dds to the
URL.
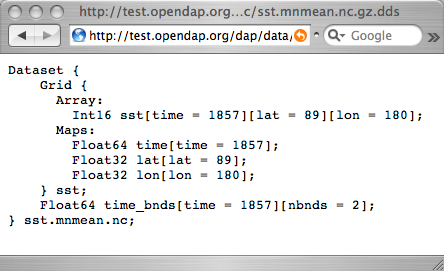
From the DDS shown, you can see that the dataset consists of two different pieces:
- A "Grid" containing a three-dimensional array of integer values (Int16) called sst, and three "Map" vectors:
- A 89-element vector called "lat",
- A 180-element vector called "lon",
- A 1857-element vector called "time", and
- A 1857 by 2 array called "time_bnds".
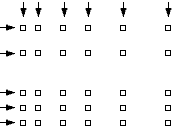
The Grid is a special OPeNDAP data type that includes a multidimensional array, and map vectors that indicate the independent variable values. That is, you can use a Grid to store an array where the rows are not at regular intervals. Here's a diagram of a simple grid:
A Grid
The array part of the grid (like sst in the example above) would contain the data points measured at each one of the squares, the X map vector would contain the horizontal positions of the columns (like the lon vector above), and the Y map vector would contain the vertical positions of the rows (like the lat vector above).
Of course you can also use a Grid to store arrays where the columns and rows are at regular intervals, and you'll often see OPeNDAP data stored that way.
(The other special OPeNDAP data type worth worrying about is the Sequence . You'll see more about them later. There are also Structures for representing arbitrary hierarchies.)
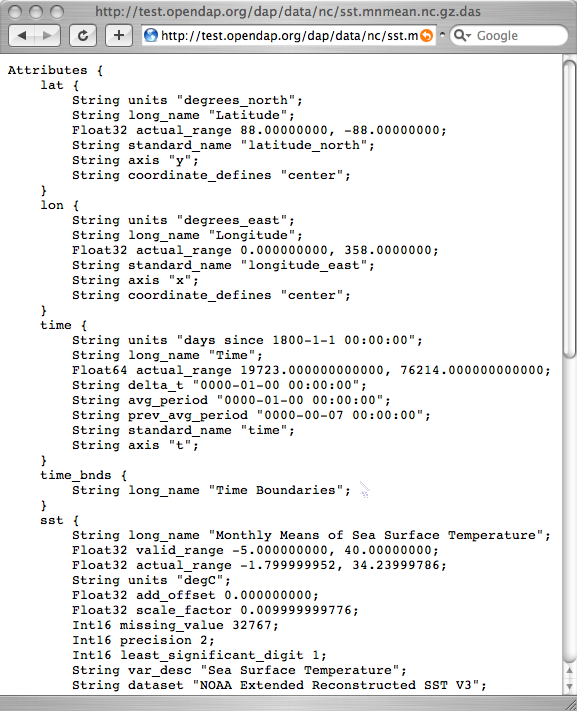
You can see from the DDS that the Reynolds data is in a 89x180x1857 element grid, and the dimensions of the Grid are called "lat", "lon", and "time". This is suggestive, but not as helpful as one could wish. To find out more about what the data is, you can look at the other important OPeNDAP structure: the Data Attribute Structure, or DAS. This structure is somewhat similar to the DDS, but contains information about the data, such as units and the name of the variable. Part of the DAS for the Reynolds data we saw above is shown in the figure below. Click sst.mnmean.nc.gz.das to see the rest of it.
NOTE: Unlike the DDS, the DAS is populated at the data
provider's discretion. Because of this, the quality of the data in it (the metadata) varies widely. The data in the Reynolds dataset used in this example are COARDS compliant. Other metadata standards you may encounter with
OPeNDAP data are HDF-EOS, EPIC, FGDC, or no metadata at all.
Now we can tell something more about the data. Apparently the
lat vector contains latitude, in degrees north, and the range is
from 89.5 to -89.5. Since this is a global grid, the latitude values
probably go in order. We can check this by asking for just the
latitude vector, like
http://test.opendap.org/dap/data/nc/sst.mnmean.nc.gz.ascii?lat
What we've done here is to append a constraint expression to the OPeNDAP URL, to indicate how to constrain our request for data. Constraint expressions can take many forms. This guide will only describe a few of them. (You can refer to the User's Guide for more complete information about constraint expressions.) Try requesting the time and longitude vectors to see how this works.
According to the DAS, time is kept in "days since 1800-1-1 00:00:00" in this dataset. This DAS also contains the actual time period recorded in the data (19723 to 76214) which, because of your familiarity with the Julian calendar, you instantly recognize as beginning January 1, 1854.
OPeNDAP provides an info service that returns all the information we've seen so far in a single request. The returned information is also formatted differently (some would say "nicer"), and you can occasionally find server-specific documentation here, as well. Some will find this the easiest way to read the attribute and structure information described above. You can see what information is available by appending .info to a URL, like this:
http://test.opendap.org/dap/data/nc/sst.mnmean.nc.gz.info
Peeking at Data
Now that we know a little about the shape of the data, and the data attributes, let's look at some of the data.
You can request a piece of an array with subscripts, just like in a C program or in Matlab or many other computer languages. Use a colon to indicate a subscript range.
...sst/mnmean.nc.ascii?time[0:6]
This URL will produce
Part of a vector
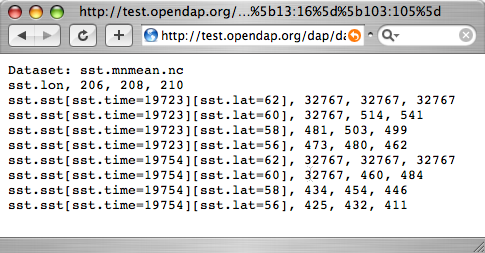
If you are interested in the Reynolds dataset, you are probably more interested in the sea surface temperature data than the dependent variable vectors. The temperature data is a three-dimensional grid. To sample the sst Grid, you just add a dimension for time:
...sst/mnmean.nc.ascii?sst[0:1][13:16][103:105]
This produces something like:
Notice that when you ask for part of an OPeNDAP Grid, you get the array part along with the corresponding parts of the map vectors.
One potentially confusing thing about this request is that we requested the time, latitude and longitude by their position in the map vectors, but in the returned information they are referenced by their values. That is, we asked for the 0th and 1st time values, but these are 19723 and 19754. We also asked for the 103rd, 104th and 105th longitude values, but these are 206, 208, and 210 degrees, respectively. The value 434 in the return can be referenced as
...sst/mnmean.nc.ascii?sst[1][15][103]
Note that the sst values are in Celsius degrees multiplied by 100, as indicated by the scale_factor attribute of the DAS. Further, it's important to remember with this dataset, that the data were obtained by calculating spatial and temporal means. Consequently, the data points in the sst array should be ignored when the value is the missing data flag (32767) as these pixels are probably coincident with land (although there can be other reasons for missing data).
Server Functions: Looking at geo-referenced data using Hyrax
There are a number of different DAP servers that have been developed by different organizations. Hyrax, the DAP server developed by the OPeNDAP group, supports access to geo-referenced data using lat/lon coordinates. You probably noticed that the array and grid indexes used so far are not very intuitive. You can see the data are global and are indexed by latitude and longitude, but in the previous example we first looked at the lat and lon vectors, saw which indexes corresponded to which real-world locations and then made our accesses using those indexes.
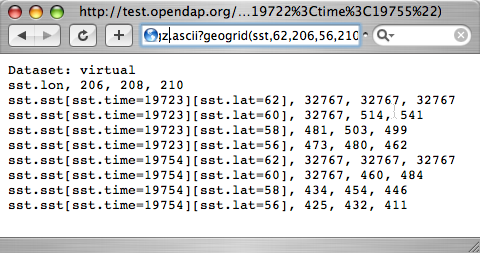
Hyrax supports a small set of functions which can perform these look-up operations for you. For example, we could rewrite the example above like this:
...mnmean.nc.gz.ascii?geogrid(sst,62,206,56,210,"19722<time<19755")
This produces:
The Syntax for geogrid() is:
- geogrid(grid variable, upper latitude, left longitude, lower latitude, right longitude, other expressions)
Where other expressions must be enclosed in double quotes, and can be one of these forms:
- variable relop value
- value relop variable
- value relop variable relop value
"Relop" stands for one of the relational operators: <,>,<=,>=,=,!=. "Value" stands for a numeric constant, and "Variable" must be the name of one of the grid dimensions. You can use multiple clauses by separating them with commas, but each clause must be surrounded by double quotes. For example, the following is yet another way to get the same return data as the above example.
...mnmean.nc.gz.ascii?geogrid(sst,62,206,56,210,"19722<time","time<19755")
You can figure out which functions are supported by Hyrax by calling
the server function
version(). This will return an XML document that
shows each registered function and its version.
To find out how to call each function, you can call it with an empty parameter list and get some documentation for that function. For example, try ...?geogrid().
More fun with Server Functions
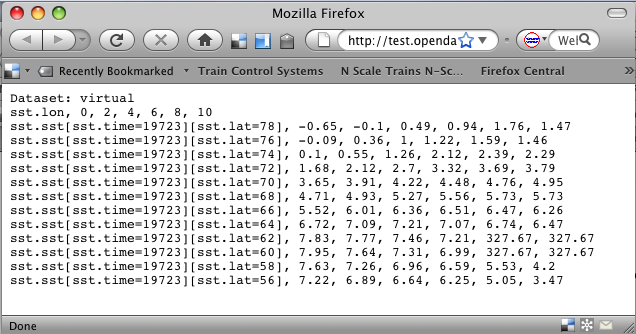
Server functions can be composed to form pipelines, feeding the value of one function to another. Since the values in this data set are scaled up by a factor of 100, we can use the linear_scale() function to scale the result using
y = mx + b
where m is the scale factor and b offset. The linear_scale() function syntax is:
- linear_scale(variable, scale factor, offset)
- linear_scale(variable)
Use the first form when you want to specify m and b explicitly or the second form when Hyrax can guess the values using data set metadata (you'll get an error if the server cannot figure out value to use).
...nc.gz.ascii?linear_scale(geogrid(sst,78,0,56,10,"time=19723"),0.01,0)
This produces:
Sequence Data
Gridded data works well for satellite images, model data, and data compilations such as the Reynolds data we've just looked at. Other data, such as data measured at a specific site, is not so readily stored in that form. OPeNDAP provides a data type called a Sequence to store this kind of data.
A Sequence can be thought of as a relational data table, with each
column representing a different data variable, and each row
representing a different measurement of a set of values (also called an
"instance"). For example, an ocean temperature profile can be stored
as a Sequence with two columns: pressure and temperature. Each
measurement is a pressure and a temperature, and is contained in one row. A
weather station's data can be stored as a Sequence with time in one
column, and each weather variable occupying another column.
You can find a good example of a Sequence at:
http://test.opendap.org/dap/data/ff/gsodock.dat
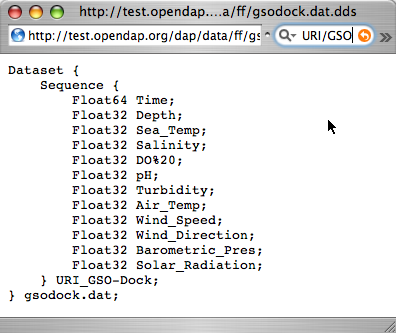
This is a 24-hour record of measurements at a weather station on a dock in Rhode Island. Each record consists of a dozen different variables including air temperature, wind speed, and direction, as well as depth, temperature and salinity of the water. The data is arranged into 144 measurements of each of the twelve variables.
Ask for the DDS, and you'll see the twelve variables, all contained in a Sequence called URI_GSO-Dock:
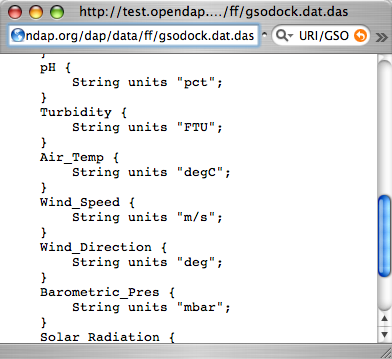
The DAS contains the units for each data type, and a little other information:
To select which data you want from a server, use a constraint expression, just as you did with the gridded data above. Now, though, the constraint contains two kinds of clauses. One is a list of variables you wish to have returned, and the other is the conditions under which they should be returned. The first is called the projection clause and the second the selection clause.
For example, if you want to see salinity data read after noon that day, try this:
...gsodock.dat.ascii?URI_GSO-Dock.Salinity&URI_GSO-Dock.Time>35234.5
Selection clauses can be stacked endlessly against a projection clause, allowing all
the flexibility most people need to sample data files. Here's an
example of applying two conditions:
...gsodock.dat.ascii?URI_GSO-Dock.Salinity&URI_GSO-Dock.Time>35234.5&URI_GSO-Dock.Depth>2
Try it yourself with three or four conditions, or more.
An Easier Way
OPeNDAP also includes a way to sample data that makes writing a constraint expression somewhat easier. Append .html to the URL, and you get a form that directs you to add information to sample the data: ...sst.mnmean.nc.html
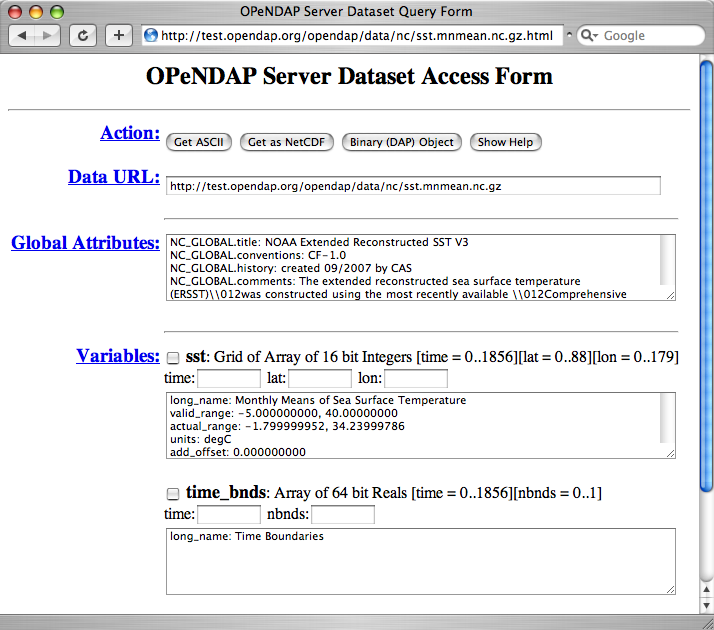
Sending a URL ending in .html returns a form like this:
It's useful to have a browser window open with one of these query forms in it while you read this section. Right or Control click here to bring up a copy of the form to use while you read.
Near the top of the page, you'll see a box entitled "Data URL". At
this point, if you've been following along, it should look pretty
familiar. If you're just jumping in, it's the OPeNDAP URL connected to
the data we're interested in, but unsampled (that is, there's no
constraint expression on it).
Moving down the page, there is a list of "Global Attributes", which
is really just for your perusal. There's not much to
be done with this, but it is often helpful information.
The important part of the page is the "Variables" section. For each variable in the
dataset, you'll see the data description (something like "Array of 32 bit Reals
[lat = 0..88]"), a checkbox, a text input box, and a list of the
variable's attributes. If you click on the checkbox, you'll see the
variable's array bounds appear in the text box, and you'll see the
variable appear in a constraint expression appended to the Data URL at
the top of the page. If you edit the array bounds in the text box,
hitting "enter" will place your edits in the Data URL box.
In the unlikely event you dare try all this without your
documentation along, there's a Show Help
button up near the top of the page. Clicking there will show you
instructions about how to proceed.
NOTE: You'll see a "stride" mentioned. This is another way to
subsample an OPeNDAP array or Grid. Asking for lat[0:4] gets you the first five members of the lat array. Adding a stride value allows you to skip array values. Asking for lat[0:2:10] gets you every second array value between 0 and
10: 0, 2, 4, 6, 8, 10.
Move on down the variable list, editing your request, and experiment with adding and changing variable requests.
When you have a request you'd like to make, look at the buttons at the top of the page.
Dataset Access Form Detail
You can click on Get ASCII, and the data request will appear in a browser window, in comma-separated form. The Binary (DAP) Object button will save a binary data file on your local disk, and the Get as NetCDF will save the file in netCDF format on your local disk. (You can read either of these later with several OPeNDAP clients, by giving it the file name instead of a URL.)
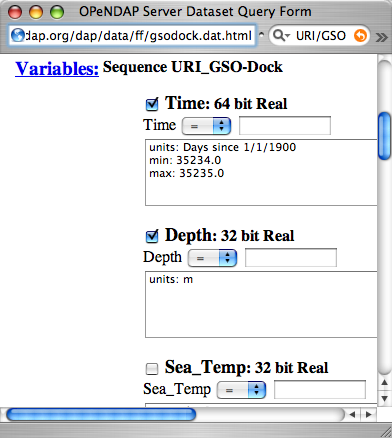
The OPeNDAP Data Access Form interface works for Sequence data as well as Grids. However, since Sequence constraint expressions look different than Grid expressions, the form looks slightly different, too. You can see that the variable selection boxes allow you to enter relational expressions for each variable. Beside that, however, the function is exactly the same.
Dataset Access Form for Sequence Data (detail)
Click here to see a copy of a Sequence form. Click the checkboxes to choose which data types you want returned, and then add constraint expressions as desired. This data file contains a day's record of changing water properties off a dock in Rhode Island. If you click the Depth and Time boxes (as in the figure), you'll get a record of the tide going in and out twice. You can add conditions by entering values in the text boxes. See what you get when you limit the selection to records where the Depth is greater than 2 meters.
NOTE: The OPeNDAP project supports the server standard and also
provides server software. Other groups also provide server software. This means that not all OPeNDAP servers support all the OPeNDAP functionality. There are a few OPeNDAP servers out there in the world that only support the bare minimum required by the standard. That minimum is to respond to queries for the DDS, DAS, and (binary) data. The ASCII data and the web access form are optional add-ons that are
not required for the basic OPeNDAP function.
Finding More OPeNDAP URLs
The OPeNDAP package was developed to improve ways to share data among scientists. Many times, data comes in the form of a URL enclosed in an email message. But there are several other ways to find data served by OPeNDAP servers.
GCMD
The Global Change Master Directory is a source of a huge amount of earth science data. They now catalog OPeNDAP URLs for the datasets that have them. You can search on "OPeNDAP" right from the main page to find many of these datasets. Try that search, then click on one of the data set names that returns, and look at the bottom of the resulting Set Description page, under the heading ``Related URL.
If you make that search, check the list for the Reynolds data from chapter~1; it should be there.
Web Interface
This is a little bit sneaky. Many sites that serve one OPeNDAP dataset also serve others. The OPeNDAP web interface (if it's enabled by the site) allows you to check the directory structure for other datasets. For example, let's look at the Reynolds data we saw previously:
http://test.opendap.org/dap/data/nc/sst.mnmean.nc.gz.html
If we use the same URL, but without the file name at the end, we can browse
the directory of data:
http://test.opendap.org/dap/data/nc/
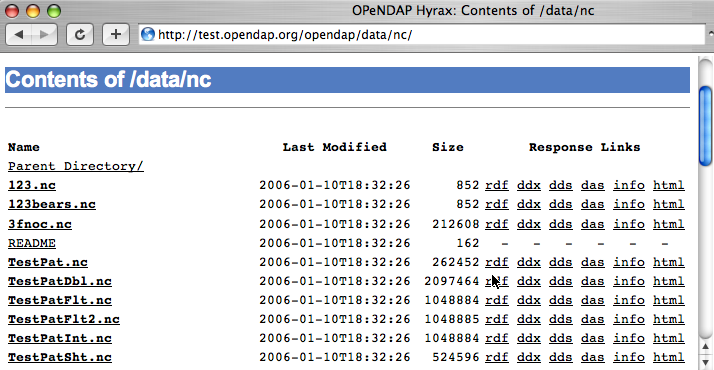
The OPeNDAP server checks to see whether the URL is a directory, and if
so, it generates a directory listing, like this:
You can see from the directory listing that the monthly mean dataset we've been looking at is accompanied by a host of other datasets. The site you're looking at is our test data site - we use these datasets to run many of our nightly tests. All of the files in the the /data/nc directory are stored in NetCDF files; other directories under /data hold data stored in other file types.
Note: In general, this list is produced by an
OPeNDAP server and this feature works on all servers. However, it only really understands OPeNDAP data files, so other file types will simply be sent without any interpretation. This can be useful if the 'other file' happens to be a README or other documentation file since this makes it simple to serve data stored in files and documented using plain text files - essentially the person or organization
providing data doesn't need to do anything besides installing the server.
File Servers
Some datasets you'll find are actually lists of other datasets. These are called file servers and are themselves OPeNDAP datasets, organized as a Sequence, containing URLs with some other identifying data (often time). You can request the entire dataset, or subsample it just like any other OPeNDAP dataset.
NASA's atmospheric composition data information services maintains some OPeNDAP file servers:
http://acdisc.sci.gsfc.nasa.gov/opendap/catalog/DatapoolCatalog/AIRS/contents.html
Try selecting one of the datasets listed in the above, and look at the DDS and DAS of that dataset. You'll see it's a list of OPeNDAP URLs (called DODS_URL here), labeled with the date of measurement. If you go to the html form for one of them, and click on the DODS_URL checkbox to get a list of URLs, and then add some conditions (try limiting the files to data from 2003), and click Get ASCII. Now you can cut and paste the resulting URLs to get more data.
Further analysis
This guide is about forming an OPeNDAP URL. After you have figured out how to request the data, there are a variety of things you can do with it. (OPeNDAP software mentioned here is available from the OPeNDAP Home Page .)
- Use a generic web client like geturl (a standard part of the OPeNDAP package), the free programs wget or lynx, or even a browser like Netscape Navigator or Internet Explorer to download data into a local data file. To be able to use the data further, you will probably have to download the ASCII version by using the .ascii suffix on the URL, as in the examples shown.
- There are pre-packaged OPeNDAP clients available that can download binary OPeNDAP data from the web into a useful form. As of today, command line clients (loaddods) are available for the Matlab and IDL data analysis environments, with which you can download OPeNDAP data directly into IDL or Matlab objects.
- The Ferret and GrADS free data analysis packages both support OPeNDAP. You can use these for downloading OPeNDAP data, and for examining it afterwards. (There are limitations. As of \today , Ferret can not read datasets served as Sequence data.)
- The Matlab analysis package also supports an OPeNDAP client attached to a graphical user interface. You can use the GUI to create a constrained OPeNDAP URL, and download the data directly into Matlab. The The OPeNDAP Matlab GUI contains more information about the Matlab GUI client.
- If you have a data analysis program or package that you like, you can look into the possibility of linking that package to the OPeNDAP toolkit library, in effect making your program into a web-capable OPeNDAP client. OPeNDAP libraries exist to mimic the behavior of the netcdf, HDF and JGOFS data access APIs. If your program already uses one of these APIs, getting it to run with OPeNDAP may be as simple as changing the libraries to which you link it. The The OPeNDAP User Guide describes how to do this, and the The OPeNDAP Toolkit Programmer's Guide describes how you can use the OPeNDAP toolkit directly to create a new application that doesn't use one of the established data access APIs.
The use of these clients, like the ways in which you can analyze the data you find, is beyond the scope of this document. Enjoy.
