OPeNDAP Data Connector Web Guide: Difference between revisions
No edit summary |
No edit summary |
||
| Line 91: | Line 91: | ||
The retrieve panel looks like this: | The retrieve panel looks like this: | ||
[[image:ss_retrieval.png | [[image:ss_retrieval.png]]<br> | ||
When you click "To Retrieve" in one of the search panes (or double-click) the selected dataset will appear in the "Datasets" area of this screen (upper left). You can also add an URL manually by typing it in the "Location" bar at the top of the screen and pressing the "Add to List" button.<br> | When you click "To Retrieve" in one of the search panes (or double-click) the selected dataset will appear in the "Datasets" area of this screen (upper left). You can also add an URL manually by typing it in the "Location" bar at the top of the screen and pressing the "Add to List" button.<br> | ||
Revision as of 16:12, 5 May 2011
 |
OPeNDAP Data Connector Web Guide |
The OPeNDAP Data Connector (ODC) can search for, retrieve and plot datasets published by OPeNDAP data servers. It can help you preview data and move it into the application of your choice. The ODC works on virtually any computing platform including the PC, Macintosh and most Unix- or Linux-based computers.
This web guide to ODC illustrates all of its major features and shows you how they work:
|
When you first start the ODC you will see a splash screen while the program loads and then the interface will appear. Normally the interface starts on the search page. At the top of interface you will see two rows of tabs like this: |
Using the Tabs
The top row of tabs, search, retrieve, view and help, are the kinds of features. Each of these has sub tabs. For example, as you can see from the screen shot above the search tab has four sub-tabs: Dataset List, Favorites, Recent and GCMD.
There are no menus in the ODC like you find in some applications. This is because menus are more appropriate for document-based applications wheras tabbed interfaces are better for control/activity-based applications like the ODC.
To explore you can return to the web guide or investigate the tabs:
Search features
There are four main kinds of search:
Dataset List A unified list of known data sources maintained at UCAR
GCMD NASA's Global Change Master Directory
Favorites Datasets that you have asked to be in your favorite's list
Recent Datasets you have recently used
Using a Search Interface
The basic idea is the same for all four of the search panels. You search for a dataset you are interested in, select it and then click the red "To Retrieve" button. The button is red with a network icon to indicate that when you click it you will be doing a network access.
A shortcut in all the search panels is to double-click the desired dataset. This has the same effect as clicking the "To Retrieve" button.
Using the Dataset List
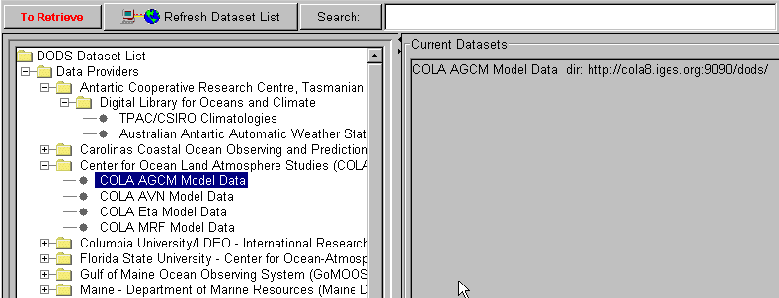
The dataset list search interface looks like this:
On the left side is a directory tree showing various organizations and their data. On the right is an information pane. When you select a given dataset information about will appear in the information pane.
The "To Retrieve" button located in the upper left is used to move the dataset to the retrieve pane where you can get get data out of it.
You can search the entire tree by entering a word in the search box and clicking the "Search" button. This will winnow the tree so that it contains only nodes with the requested word. If you search returns no matches the tree will be unchanged and a message will appear in the status bar at the bottom of the screen announcing that there were no matches.
To return to the entire tree make the text box blank and click the search button.
There is also a button "Refresh Dataset List". This will go out onto the network and retrieve the most recent version of the dataset list available from UCAR.
Using the GCMD
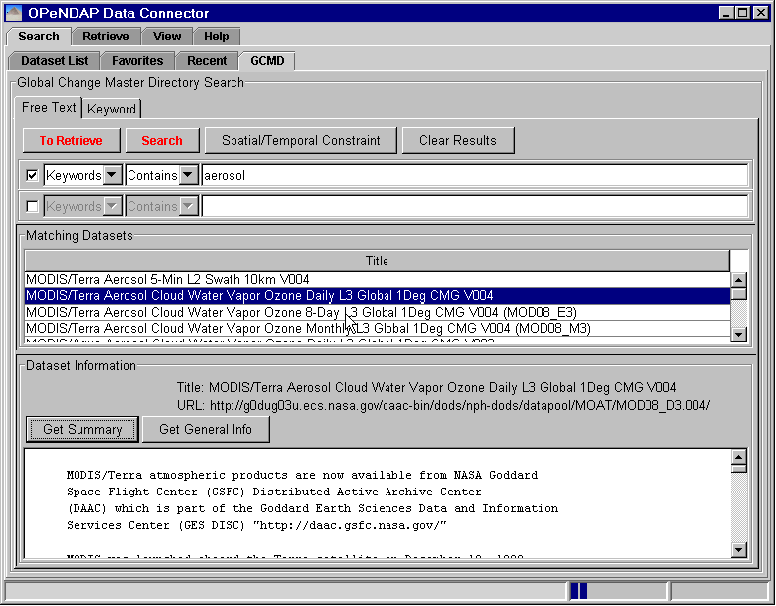
The GCMD search interface looks like this:

It has two tabs: Free Text and Keyword search.
In the screen shot the user has done a free text search on the word "aerosol" and the results that were returned are shown in the list in the middle. When a result is selected you can click the "Get Summary" button to get further textual information about the dataset which appears in the lower pane of the screen.
In addition to using search text you can constrain the results geospatially and temporally. To get information about doing this see the web guide on the
<a href="ODC_Webguide_geospatial">Geospatial Panel</a>
Retrieve functionality
The retrieval panel allows the user to navigate server directories, see the structure of the data, constrain the data query and output the data to one of various output options.
Using the Retrieval Panel
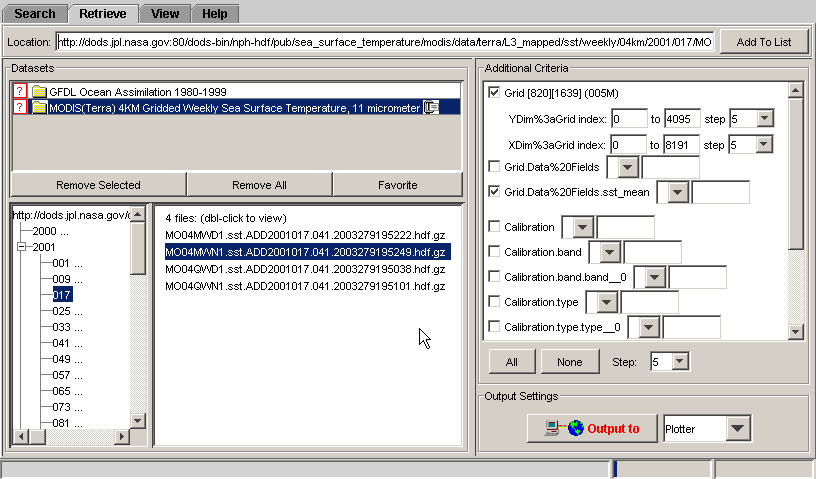
The retrieve panel looks like this:
When you click "To Retrieve" in one of the search panes (or double-click) the selected dataset will appear in the "Datasets" area of this screen (upper left). You can also add an URL manually by typing it in the "Location" bar at the top of the screen and pressing the "Add to List" button.
If the URL points to a directory, the directory browser will become active in the lower left. In the screen shot above the user has selected a NASA MODIS directory and has drilled down into by double-clicking in the directory navigator. Note that many of the entries in the navigator have an ellipsis ("...") after them. That means that the directory has not been visited so the ODC does not know what they contain. The user must explicitly double-click a directory to see its contents. This action does a web hit.
When a directory has been retrieved any files it contains will be shown in the list to the immediate right of the directory navigator.
Double-clicking a file will cause its structure to be retrieved and shown in the "Additional Criteria" panel on the right. In the screenshot above you can see that the user has double-clicked on the file O04MWN1.sst.ADD2001017.041.2003279195249.hdf.gz and its structure has been displayed. The file has a lot of variables in it, seven of which are visible in the Additional Criteria pane.
Selecting and Contraining Data
Use the "Additional Criteria" panel located on the right to select and constrain the variables you want out of a given dataset. A dataset may have only one or many variables. The structure of OPeNDAP data is hierarchical, but the view shown in this panel lists each variable in a flat list. For example, in the screen above the variable "band_0" is inside a structure called "band" which itself is inside a structure called "Calibration".
Here the user has selected two variables "Grid" and "Grid.Data Fields.sst_mean". Note that the space in "Data Fields" shows as a "%20". This is an escape mechanism that will allow the request to be sent over the internet without the space interrupting request.
The user has also sub-sampled the grid by picking a step of 5. This will return only every fifth value in each dimension (or every 25th value overall). By doing this the download has been made significantly smaller.
You can see the size of download for grid and array variables after them in brackets. For example, in the screen shot above the download will be 5 megabytes.
When the user is ready to output the data (here the output is set to the plotter) the "Output" button will be pressed. The View / Plotter panel will then automatically be activated and the data will be downloaded.
<a href="ODC_Webguide">return to Webguide Home</a>
View features
The view / plot panel allows the user to plot the data.
Using the Plot Panel
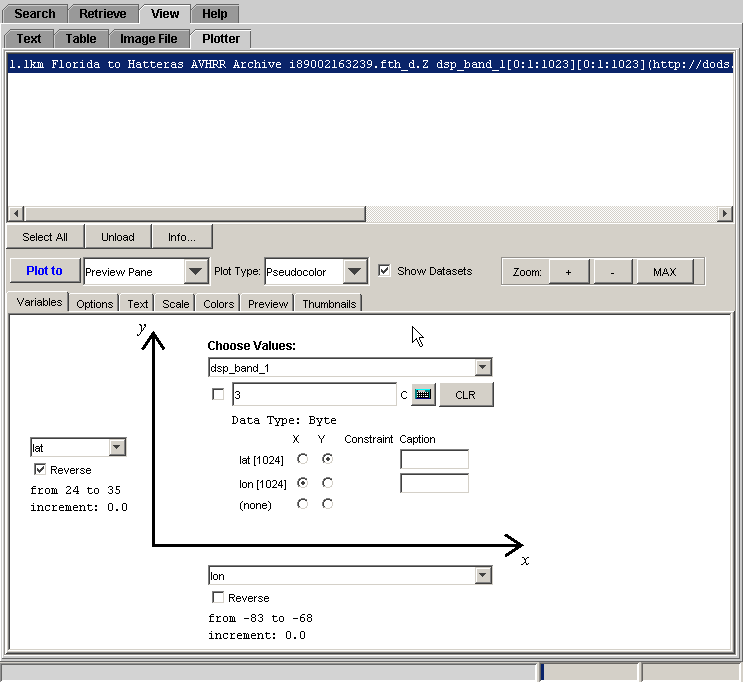
The plot panel looks like this:

When data is sent from the retrieve panel to the plotter using the "Output to" button, the title of the dataset will appear in the list at the top of the plot panel (this list can be hidden with the "Show Datasets" checkbox).
After selecting a dataset the user needs to indicate what kind of plot they want to do, pseudocolor, vector, xy or histogram. Pick an item from the "Plot Type" drop-down list to do this.
When a given dataset is selected from this list the "Variables" sub-tab below allows the user to indicate which variable to plot and how to configure the axes as well as other options. Here the user has indicated that the variable "dsp_band_1" should be the variable plotted and the axes should be scaled by the vectors "lat" and "lon". If the data is in the format of a grid the ODC can automatically configure the axes in many cases. Select an output destination in the drop-down list next to the blue "Plot" button and click the button. The plot will be generated.
<a href="ODC_Webguide_plotgallery">check out the ODC Plot Gallery</a>
<a href="ODC_Webguide">return to Webguide Home</a>


