How to use ''Instruments'' on OS/X to profile
From OPeNDAP Documentation
⧼opendap2-jumptonavigation⧽
The instruments profiles can be run from the command line, but it doesn't seem to pick up the symbols for the executables when run that way with Xcode 9. Here's how to fix that.
Building symbols
Even though executables are built using -g3 -O0, OS/X clang/gcc dies not include those symbols in binary images built by the linker. To make that info available to instruments, use the program dsymutil on the executable, .dylib and/or .so. This may be an iterative process; see the next section.
Running instruments
Once the <name>.dSYM directories are built, run the instruments GUI and:
- Click the menu to Choose Target...

- Navigate to the program to run - yes, it's tedious.
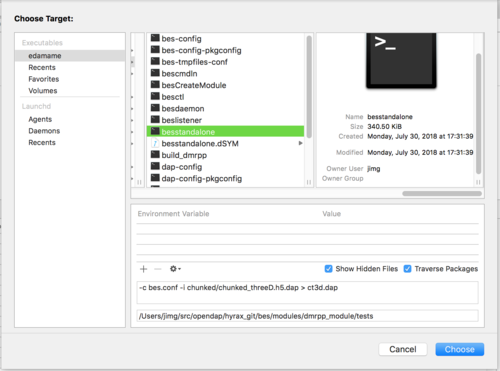
- Choose the program (note that the dSYM dir is there too)
- provide the arguments to the program
- and, below that, the full path to the working directory.


The red dot
Now click the 'Run' button (the red dot) 
Here's the result 
Click to expand (and click the arrow in the circle to examine a sub-hierarchy of calls) 